
Marketing and Smart Technologies pp 406-419 | Cite as
Business Intelligence and Data Mining to Support Sales in Retail
- 1 Citations
- 1.2k Downloads
Abstract
Markets are increasingly competitive, and organizations are constantly finding ways to improve their data processing in order to be able to find their customers’ behavioral patterns when they buy their products. The aim of this study is to create a body of knowledge, so that a project can use the tools and techniques associated with data mining in retail sales in a proper way, presented concepts and key techniques like market basket analysis, association rules and cross-selling and up-selling. Companies make expert use of statistics and modeling to improve a wide variety of functions. In the paper are presented some common applications of business intelligence. As well as successful examples of data mining applied to retail sales, some information is also presented in this work to explain the prospects for the future of retail.
Keywords
Data mining Business intelligence Market basket analysis Sales Retail38.1 Introduction
Markets are increasingly competitive in almost all areas of economic activity. The retail industry encompasses the journey of a good or service. This typically starts with the manufacturing of a product and ends with the said product being purchased by a consumer from a retailer. Global retail sales in 2016 were around 22 trillion U.S. dollars and projected to amount around 28 trillion U.S. dollars by 2020 [1]. For example, the sports market is a global market and is growing driven by an increasing portion of the population living healthier lifestyles and stronger participation in sports and fitness activities [2]. In 2019, the revenue in the e-commerce market segment of Sports & Outdoor amounts to €213 million and is expected to show an annual growth rate of 6.6% [3]. The objective of this work is the study of solutions to be used in a project that applies business intelligence solutions that improve business competitiveness and efficiency in the retail sector, relating information using data mining techniques, like market basket analysis.
38.2 Business Intelligence
In modern retail business, increasing standards, automation, and technologies have led to vast amounts of data becoming available, however, business decision-making process has become complicated. Business Intelligence (BI) technologies emerge as the times require. Business Intelligence is a very wide-ranging set of the collection, consolidation, analysis and information access capabilities for a solution, data warehouse, data query and reporting, multidimensional data analysis, data mining, and other technologies [4].
Business Intelligence and Analytics (BI&A) and the related field of big data analytics have become increasingly important in both the academic and the business communities over the past two decades. BI became a popular term in the business and IT communities only in the 1990s. In the late 2000s, business analytics was introduced to represent the key analytical component in BI [5].
- 1.
Fast data processing: BI can access data in any time or department segment, realize the function of data array, data selection, and data format conversion. Data processing speed and capacity are fully protected.
- 2.
Intelligent correlation analysis: BI makes full use of the mathematical model, profoundly reveals enterprises operating rules, and provides enough scientific decision-making material.
- 3.
Multidimensional analysis target: BI gives a combined analysis in the object of merchandise, brands, manufacturers, suppliers, category, price, and so on, which creates the material for multidimensional data structure.
- 4.
Progressive analysis result: In practical applications, BI can get the most specific decision-making data through continuous analysis and progressive selection. BI often uses Key Performance Indicators (KPI) to assess the present state of business and to prescribe a course of action.
There are key technologies of business intelligence like Data Warehouse, Online Analytical Processing (OLAP), Data Mining, and Release and Express technology. Some of them will be explained in point 3, OLAP and the Release and Express Technology will be explained in the following points.
38.2.1 Online Analytical Processing (OLAP)
Online Analytical Processing (OLAP) is an approach to quickly provide answers to analytical queries that are multidimensional in nature. The typical applications of OLAP are in business reporting for sales, marketing, management reporting, business process management, budgeting and forecasting, financial reporting, and similar areas. In the core of any OLAP system is a concept of an OLAP cube (also called a multidimensional cube or a hypercube) [7, 9]. It consists of numeric facts called measures which are categorized by dimensions. The cube metadata is typically created from a star schema or snowflake schema of tables in a relational database. Measures are derived from the records in the fact table and dimensions are derived from the dimension tables [8].
38.2.2 Release and Express Technology
Applications of business intelligence—adapted from [9]
Function | Description | Examples |
|---|---|---|
Supply Chain | Simulate and optimize supple chain flows; reduce inventory and stock-outs | Dell, Walmart, Amazon |
Customer selection, loyalty, and service | Identify customers with the greatest profit potential; increase likelihood that they will want the product or service offering; and retain loyalty | Harrah’s, Capital One, Barclays |
Pricing | Identify the price that will maximize yield, or profit | Progressive, Marriott |
Human Capital | Select the best employees for tasks or jobs, at compensation levels | New England Patriots, Oakland A’s, Boston Red Sox |
Product and service quality | Detect quality problems early and minimize them | Honda, Intel |
Financial Performance | Better understand the drivers of financial performance and the effects of nonfinancial factors | MCI, Verizon |
Research and development | Improve quality, efficacy, and, where applicable, safety of products and services | Novartis, Amazon, Yahoo |
The UK Consumer Cards and Loans business within Barclays Bank, for example, spent five years executing its plan to apply analytics to the marketing of credit cards and other financial products. The company had to make process changes in virtually every aspect of its consumer business: underwriting risk, setting credit limits, servicing accounts, controlling fraud, cross-selling, and so on. On the technical side, it had to integrate data on 10 million Barclaycard customers, improve the quality of the data, and build systems to step up data collection and analysis. In addition, the company embarked on a long series of small tests to begin learning how to attract and retain the best customers at the lowest price. And it had to hire new people with top-drawer quantitative [9].
38.3 Data Mining
Data mining, as the term is used, is the exploration and analysis of large quantities of data in order to discover meaningful patterns and rules [10]. Data mining supports knowledge discovery by finding hidden patterns and associations, constructing analytical models, performing classification and prediction, and presenting the mining results using visualization tools [11].
The retail industry is a well-fit application area for data mining since it collects huge amounts of data on sales, customer shopping history, goods transportation, consumption, and service. The quantity of data collected continues to expand rapidly, especially due to the increasing availability, ease, and popularity of business conducted on the web, or e-commerce. Retail data mining can help identify customer buying behaviors, discover customer shopping patterns and trends, improve the quality of customer service, achieve better customer retention and satisfaction, enhance goods consumption ratios, design more touching goods transportation and distribution policies, and reduce the cost of business [11].
38.3.1 Data Mining Forms and Cycle
Data Mining comes in two forms: directed and undirected. Directed data mining attempts to explain or categorize some target fields such as income or response classification, estimation, and prediction. Undirected data mining attempts to find patterns or similarities among groups of records without the use of a target field or collection of predefined classes, as examples of undirected tasks are affinity grouping and clustering [10].
- 1.
Identifying the business problem.
- 2.
Mining data to transform the data into actionable information.
- 3.
Acting on the information.
- 4.
Measuring the results.
Data Mining provides many different techniques to extract knowledge from data. It is a multidisciplinary field of research that has many extremely useful applications. At the present time the techniques are becoming more commonly used but have not been applied adequately in the store layout. Store layout problem is motivated by applications known as market basket analysis to find relationships between items purchased by customers [12]. The store layout is an important retailing decision that can help or harm sales and store profitability. Store layouts are extremely important because they strongly influence in-store traffic patterns, shopping atmosphere, shopping behavior, and operational efficiency. Store layout design can play a key role not only in satisfying buyers’ requirements but also in influencing their wants and preferences. Store layout affects consumers’ price acceptability, which is positively related to purchase intentions [13]. They also report that superstores are currently revolutionizing the nature of retail service, mainly by creating more effective self-service arrangements as a result of improvements in store layout design [12].
38.3.2 Data Warehouse
Data warehouses collect and coalesce data from across an enterprise, often from multiple transaction-processing systems, each with its own database. Data is gathered because it is needed for some operational purpose, such as inventory control or the billing and, once it has served that purpose, it languishes on disk or tape or is discarded [10]. Analytical systems can access data warehouses. Data warehousing may be a facilitating technology of data mining. It is not always necessary, as most data mining does not access a data warehouse, but firms that decide to invest in data warehouses often can apply data mining more broadly and more deeply in the organization [14]. For example, if a data warehouse integrates records from sales and billing as well as from human resources, it can be used to find characteristic patterns of effective salespeople.
The goals of an initial data warehouse implementation should be specific, achievable, and measurable [11]. Building and using a data warehouse is a complex task because it requires business skills to understand how systems store and manage their data, technology skills to understand how to make assessments from quantitative information and derive facts based on conclusions from historical information in the data warehouse and program management skills to answer the need to interface with many technologies, vendors, and end-users in order to deliver results in a timely and cost-effective manner [11].
- 1.
Choose a business process to model (e.g., orders, invoices, shipments, inventory, account administration, sales, or the general ledger).
- 2.
Choose the business process grain, which is the fundamental, atomic level of data to be represented in the fact table for this process (e.g., individual transactions, individual daily snapshots, and so on).
- 3.
Choose the dimensions that will apply to each fact table record. Typical dimensions are time, item, customer, supplier, warehouse, transaction type, and status.
- 4.
Choose the measures that will populate each fact table record. Typical measures are numeric additive quantities like dollars-sold and units-sold.
Data warehouse administration includes data refreshment, data source synchronization, planning for disaster recovery, managing access control and security, managing data growth, managing database performance, and data warehouse enhancement and extension [11].
Firstly, having a data warehouse may provide a competitive advantage by presenting relevant information from which to measure performance and make critical adjustments to help win over competitors. Secondly, a data warehouse can enhance business productivity because it is able to quickly and efficiently gather the information that accurately describes the organization. Thirdly, a data warehouse facilitates customer relationship management because it provides a consistent view of customers and items across all lines of business. Finally, a data warehouse may bring about cost reduction by tracking trends, patterns, and exceptions over long periods in a consistent and reliable manner [11].
38.3.3 Market Basket Analysis
Market basket analysis (MBA) is used to determine which products sell together. The input data to a market basket analysis is normally a list of sales transactions, where each has two dimensions, one represents a product and the other represents a customer, depending on whether the goal of the analysis is to find which items sell together to the same person [13]. The main aim of MBA in marketing is to provide the information to the retailer to understand the purchase behavior of the buyer, which can help the retailer in correct decision-making [15]. MBA is transaction data that describes three fundamentally different entities: customers, orders, and items [10].
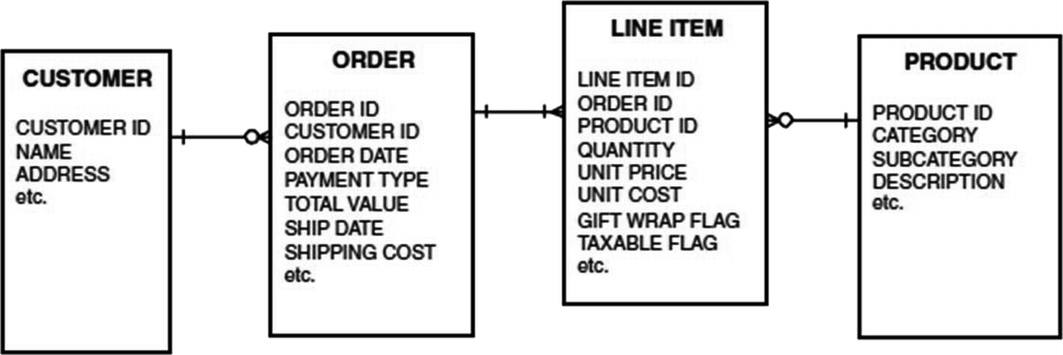
Data model for the transaction-level market basket [10]
The order is the fundamental data structure for market basket data. An order represents a single purchase event by a customer. This includes the total amount of the purchase, the total amount, additional shipping charges, payment type, and whatever other data is relevant about the transaction.
The item table also typically has a link to a product reference table, which provides more descriptive information about each product. This descriptive information should include the product hierarchy and other information that might prove valuable for analysis.
The customer table is an optional table and should be available when a customer can be identified, for example, on a website that requires registration or when the customer uses an affinity card during the transaction.
What is the average number of orders per customer?
What is the average number of unique items per order?
What is the average number of items per order?
For a given product, what is the proportion of customers who have ever purchased the product?
MBA is a technique that assists in determining which sports items are purchased together according to the association rules, primarily with the aim of identifying cross-selling opportunities. Its primary objective is to improve the effectiveness of marketing and sales tactics using the customer’s data [16]. Supposing a manager of a sports store wants to learn about the buying habit of the customers so that it can be determined which groups or sets of items customers are more likely to buy from the store. One plausible option to determine this is by performing market basket analysis on the retail history, i.e., the retail data collected from previous transactions. The main application of this analysis is in optimizing the store layout, where the items that are likely to be sold together can be placed closer to each other [16].
item—any object that is sold on the market;
basket—a container for one or more items selected by the customer;
itemset—any subset of items that are sold together, in the same shopping basket;
transaction—the complete set of items in an individual shopping basket, in the moment of purchase;
transaction database—the complete set of shopping baskets/transactions recorded by the merchant.
38.3.4 Association Rules
Given a set of records (i.e., transactions), each of which containing several items from a given collection, the goal of association-rule discovery is to produce dependency rules that can predict the occurrence of an item based on occurrences of other items [18]. For example: A store manager may wish to know how likely a customer would buy a tennis ball if he buys tennis rackets. Such knowledge can help the store manager in product arrangement, shelf space planning, and effective implementation of product promotion strategies. The items that co-occur frequently can be discovered from a customer transactions database using association rules [16].
The applications of data mining in retail trade enterprises are mainly concentrated in association rules mining. Association rule mining is an initial data exploration approach that is often applied to an extremely large data set. An example is grocery store market basket data. Association rules mining provides valuable information in assessing significant correlations. By mining association rules, marketing analysts try to find sets of products that are frequently bought together [12].
Product recommendations and promotion;
Product placement;
Next best offers strategies.
38.3.5 Cross-Selling and Up-Selling
Cross-selling is an old and valuable technique used by salespeople to increase order size and to transform single-product buyers into multiproduct ones. Cross-selling involves the sales of additional items related (or sometimes unrelated) to a previously purchased item, while up-selling involves the increase of order volume either by the sales of more units of the same purchased item, or the upgrading into a more expensive version of the purchased item. Rather than relying on a sales or services representative to decide whether to cross-sell and which item to offer, modern cross-selling utilizes analytical tools to study the customer’s past behavior, correlate this information with similar customers, and then identify potential cross-selling opportunities at each contact with the customer [19].
- 1.
There is a belief that it costs five times less to serve an existing customer than to acquire a new one [20].
- 2.
Cross-selling leads to a broader scope for the customer relationship, increasing not only share of wallet but also the firm’s “share of mind” with the customer [19].
- 3.
As the customer buys more products and services from the firm and broadens the scope of the relationship, the firm learns more about the customer’s needs and preferences, improving their ability to target marketing efforts and to cross-sell [20].
This information advantage, added with the higher costs of switching, produces a virtual local monopoly for the firm, which is then better able to compete for its customers than other firms that do not have an established relationship or access to the same information about their needs and preferences. For these reasons above, many customer-focused enterprises are taking advantage of cross-selling as a tool for customer development [19]. While implementing these cross-selling strategies, firms realized that cross-selling is more effective in inbound than outbound customer contacts. In other words, it is better to cross-sell when the customer calls the firm than to call the customer for the purpose of cross-selling. Some of the reasons for this important finding are intuitive. First, costs are lower, as the contact is initiated by the customer, and there is no waste in reaching the customer. Second, since the customer initiated the contact, the mindset is already centered on the firm and its services, simplifying the sales task. Third, if the customer called with a problem and it is solved to their satisfaction, the customer is more receptive to the cross-selling suggestion, particularly when this suggestion meets their needs. The analytical tools for cross-selling reviewed so far focused on identifying the “next-to-buy” or “next-to-offer” service, based on “natural” acquisition sequences observed across customers and over time [19].
38.4 The Future of Retail
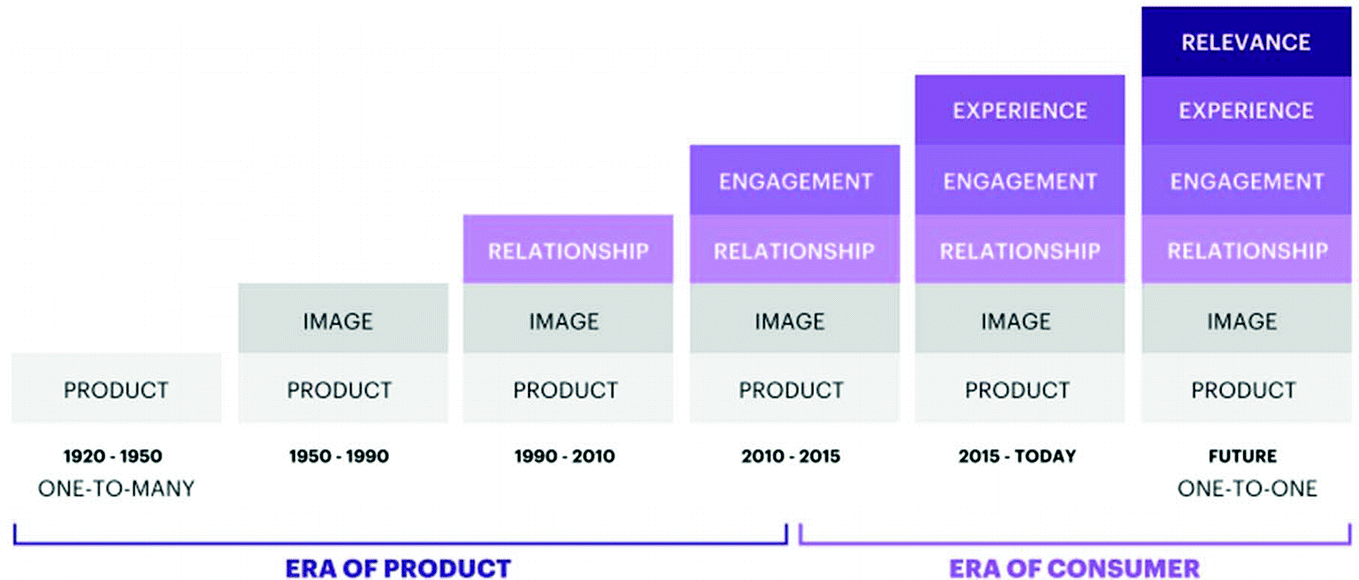
The shift from products to consumers [21]
Extended Ecosystem: capacity to manage agencies, partners, and internal functions that are constantly evolving.
Data and Insights: capacity to best leverage technologies and data to prioritize and continually improve CX.
Evolving marketing for the future: capacity to do differently and better to win, centered on customer experience.
Customer Experience: capacity to build brands with purpose and deliver experiences consistently at scale.
Customer Value proposition: capacity to identify the biggest growth opportunities, those will require new services, products or business models.
Organization Capability: capacity to engage and empower the organization’s people and ensure that there is the right talent to be successful.
For instance, shoppers might want to search and browse products on an indoor visualization of a store to obtain information such as an item’s price, color, size, and approximate location in the store. Radio frequency identification (RFID), has become promising technology in the retail environment for inventory management, supply chain management, and retail marketing, because it can be configured to detect an object’s presence, absence, or approximate location [23].
38.5 CRISP-DM Model
The Cross Industry Standard Process for Data Mining (CRISP-DM) is a freely available model that has become the leading methodology in data mining. Because of its industry and tool independence, CRISP-DM can provide guidelines for organized and transparent execution of any project [24].
The CRISP-DM methodology is described in terms of a hierarchical process model, consisting of sets of tasks described at four levels of abstraction (from general to specific): phase, generic task, specialized task, and process instant. At the top level, the data mining process is organized into several phases and each phase consists of several second-level generic tasks. The second level is called generic because it is intended to be general enough to cover all possible data mining situations. The third level, the specialized task level, is the place to describe how actions in the generic tasks should be carried out in certain specific situations. For example, at the second level there might be a generic task called clean data. The third level describes how this task differs in different situations, such as cleaning numeric values versus cleaning categorical values [25]. The description of phases and tasks as discrete steps performed in a specific order represents an idealized sequence of events. In practice, many of the tasks can be performed in a different order, and it will often be necessary to repeatedly backtrack to previous tasks and repeat certain actions.
- 1.
Business Understanding (understanding business objectives and converting them into data mining problems, developing project plan),
- 2.
Data Understanding (collection of data, verification of data quality, data exploration),
- 3.
Data Preparation (data selection, cleaning, data formatting and integration, constructing the final dataset for modeling),
- 4.
Modeling (selection of modeling techniques, building and assessment of a model),
- 5.
Evaluation (evaluation of results in the context of business objectives, reviewing the quality of the process, further decisions on deployment),
- 6.
Deployment (deployment plan, deployment execution and monitoring, final report and review of the project).
Despite clear distinction between the groups of tasks in CRISP-DM, it has been acknowledged that there is no single universal practice in information discovery. The variety of data and related issues as well as business objectives may require various degrees of flexibility in applying the CRISP-DM reference model [25].
By analyzing historical and ongoing data, companies could generate valuable knowledge, which could contribute to the optimization of processes. However, the process of data mining is a process with high complexity and a structured process model is necessary to successfully execute such projects. The most commonly preferred process model, CRISP-DM, already has proven to be a successful guideline in a variety of cases. These case studies identified relevant patterns and created predictive models from the data sources, which could be used to optimize processes [26].
38.6 Case Studies of Data Mining in Retail
- 1.
The Analytics team at Hewlett-Packard recently executed a manually driven cross-sell/up-sell pilot in the Small and Medium Business online store and call center. The pilot, for which management dictated a 1-month development timeframe, utilized sales transaction, product configuration, and product availability data. Leveraging market basket analysis techniques among a small subset of available product SKUs, the pilot yielded an ROI of more than $300 K/month and more importantly, gave birth to greater opportunities to further showcase the power of analytics and data-driven decision-making at HP [27].
- 2.
The Swedish interior giant IKEA featured image recognition and augmented reality for the first time when it showcased its 2013 catalog. Customers could scan through the catalog with their mobile devices to highlight products they were interested in, and from this, the brand offered personalized digital content and reviews to inform their purchase. The brand also used image-recognition technology, with which customers can scan catalog items and virtually place them in their own homes to see what they would look like. They can then select the colors and sizes that work best in the space, without having to go to the store and purchase the product. This allowed the catalog readers to make informed purchases, resulting in higher customer satisfaction and fewer returned items [28].
- 3.
Macy’s upmarket department store has a long history of providing excellent customer service and has become a household name. Despite the heritage established since the first store opened in 1858, the brand has taken to the digital age like a fish to water. Macy’s uses big data to offer a smarter customer’s experience. The brand analyzes multiple data points, such as stock levels and price promotions, and combines these findings with stock keeping unit data from a product at a particular location—as well as customer data—to ascertain which products are on sale in each store. This ensures that its chosen products suit the buying habits of customers in each location. On top of this, Macy’s collects customer data ranging from visit frequency to style preference. This data is used to personalize the customer experience, offering incentives at the point of sale with loyalty rewards and promotions. This data also enables it to send targeted direct mail to its customers to boost conversions [28].
- 4.
Amazon Go is the latest wave of technology in retail that is expected to lead the way to the future of AI in retail. The basic concept behind Amazon Go is that it is a new kind of store that flourishes on the concept of no checkout requirements. Consumers who walk into a store can take whatever they want without having to go through the hassle of lines and waiting for checkout. The checkout-free shopping experience in Amazon Go is only made possible using the same technology that is currently in place behind computer vision, sensor fusion, and self-driving cars. The technology automatically detects all that is being taken and keeps track of them in a virtual cart. Shortly after the consumer leaves, they will be sent a receipt and charged through their Amazon account [29].
- 5.
As Gerri Martin-Flickinger, the Chief Technology Officer and EVP at Starbucks, told CIO.com: “With about 90 million transactions a week, we know a lot about what people are buying, where they’re buying, how they’re buying. And if we combine this information with other data, like weather, promotions, inventory, rearview mirror perspective insights into local events, we can deliver better-personalized service to forward-looking, agile optimization on campaign performance after other customers.” For example, by combining predictive analytics with location fueled by predictive analytics it’s too late to make an impact data, Starbucks can send an offer to customers who are near a Starbucks based and experimentation on what the data predicts they will want on a certain day and time [21].
Retailers must redefine customer experience, engagement, and relationship—all more complex than ever because of an integrated marketplace. To be a retailer of choice, companies must embed themselves into the very fabric of a consumer’s everyday life—providing an adaptable, beneficial experience that moves beyond a simple product sale [21].
It is expected that customers will manage 85% of their relationship with the enterprise without interacting with a human.
According to a report by Business Insider, it is said that customers who interact in online opinions and reviews with retailers are 97% more likely to convert along with the retailer during this phase of change [29].
38.7 Conclusions
This paper presented some of the relevant aspects associated with the application of data mining to optimize retail store sales. In addition to the aspects associated with business intelligence, concepts and key techniques, and tools (market basket analysis, association rules and cross-selling and up-selling) that can be applied in a data mining project were discussed. In addition to a brief presentation of the CRISP-DM model, the future of retail and data mining application success stories were also presented, creating the conditions for this body of knowledge can be used in a future work related to data mining to support retail sales can be used.
References
- 1.O’Connell, L.: Total retail sales worldwide from 2015 to 2020 (2019). https://www.statista.com/statistics/443522/global-retail-sales/
- 2.Markets Insider: The growth of sales in sportswear (2017). https://markets.businessinsider.com/news/stocks/the-growth-of-sales-in-sportswear-1002249734. Accessed 15 Mar 2019
- 3.Statista Market Forecast: Sports & outdoor—Portugal (2019). https://www.statista.com/outlook/259/147/sports-outdoor/portugal?currency=eur
- 4.Gang, T., Kai, C., Bei, S.: The research & application of business intelligence system in retail industry. In: Proceedings of the IEEE International Conference on Automation and Logistics, ICAL 2008, September, pp. 87–91 (2008). https://doi.org/10.1109/ICAL.2008.4636125
- 5.Chen, H., Storey, V.C.: Business intelligence and analytics: from big data to big impact. MIS Q. 36(4), 1165–1188 (2012)CrossRefGoogle Scholar
- 6.Acito, F., Khatri, V.: Business analytics: why now and what next? Bus. Horiz. 57(5), 565–570 (2014). https://doi.org/10.1016/j.bushor.2014.06.001CrossRefGoogle Scholar
- 7.Krishnamoorthi, S., Mathew, S.K.: Business analytics and business value: a comparative case study. Inf. Manag. 55(5), 643–666 (2018). https://doi.org/10.1016/j.im.2018.01.005CrossRefGoogle Scholar
- 8.Chaudhuri, S., Dayal, U.: An overview of data warehousing and OLAP technology. ACM SIGMOD Rec. 26(1), 65–74 (1997)CrossRefGoogle Scholar
- 9.Davenport, T.H.: Competing on Analytics. Harvard Business Review (2006)Google Scholar
- 10.Berry, M.J.A., Linoff, G.S.: Data mining techniques: for marketing, sales, and customers. SIGMOD Rec. 25 (1996). https://doi.org/10.1145/235968.280351MathSciNetCrossRefGoogle Scholar
- 11.Han, J., Kamber, M., Pei, J.: Data Mining. Elsevier Inc. (2012)Google Scholar
- 12.Cil, I., Ay, D., S Turkan, Y.: Data driven decision support to supermarket layout. In 8th WSEAS International Conference on Artificial Intelligence, Knowledge Engineering & Data Bases (AIKED ’09) (2009). www.internal-pdf://237.233.27.24/Cil-2009-Data driven decision support to super.pdf Google Scholar
- 13.Bäckström, K., Johansson, U.: Creating and consuming experiences in retail store environments: comparing retailer and consumer perspectives. J. Retail. Consum. Serv. 13(6), 417–430 (2006). https://doi.org/10.1016/j.jretconser.2006.02.005CrossRefGoogle Scholar
- 14.Provost, F., Fawcett, T.: Data science for business. Mach. Learn. (2011). https://doi.org/10.1007/s13398-014-0173-7.2CrossRefzbMATHGoogle Scholar
- 15.Kaur, M., Kang, S.: Market basket analysis: identify the changing trends of market data using association rule mining. Procedia Comput. Sci. 85(2016), 78–85 (2016)CrossRefGoogle Scholar
- 16.Kaur, H., Singh, K.: Market basket analysis of sports store using association. Int. J. Recent. Trends Electr. Electron. Eng. 3(1), 81–85 (2013)Google Scholar
- 17.RapidMiner.: FP-growth (2019). https://docs.rapidminer.com/latest/studio/operators/modeling/associations/fp_growth.html. Accessed 15 Apr 2019
- 18.Gullo, F.: From patterns in data to knowledge discovery: what data mining can do. Phys. Procedia 62, 18–22 (2015). https://doi.org/10.1016/j.phpro.2015.02.005CrossRefGoogle Scholar
- 19.Kamakura, W.A.: Cross-selling: offering the right product to the right customer at the right time. J. Relat. Mark. 6(3–4), 41–58 (2008)Google Scholar
- 20.Rothfeder, J.: Trend: cross-selling (2003). https://www.cioinsight.com/c/a/Trends/Trend-CrossSelling. Accessed 15 Apr 2019
- 21.Accenture Consulting: The new retail(er) (2018). https://www.accenture.com/t20181024T092627Z__w__/mz-en/_acnmedia/PDF-87/Accenture-Retail-Living-Marketing-Updated.pdf
- 22.PWC.: Rethinking retail: The role of the physical store (2018). https://www.pwc.be/en/documents/20180627-rethinking-retail.pdf
- 23.Nur, K., Carreras, A., Pous, R., Morenza-Cinos, M.: Projection of RFID—obtained product information on a retail store’s indoor panoramas. IEEE Intell. Syst. (2015)Google Scholar
- 24.Wowczko, I.: A case study of evaluating job readiness with data mining tools and CRISP-DM methodology. Int. J. Infonomics 8(3), 1066–1070 (2015). https://doi.org/10.20533/iji.1742.4712.2015.0126CrossRefGoogle Scholar
- 25.Smart Vision Europe.: CRISP-DM (2015). http://crisp-dm.eu/. Accessed 3 May 2019
- 26.Bloothoofd, M.P., Francken, A., Graas, R.: CRISP-DM Methodology Fact Sheet (2018)Google Scholar
- 27.Kitts, B., Melli, G., Rexer, K.: Data mining case studies proceedings. In: IEEE International Conference on Data Mining (2005)Google Scholar
- 28.Greene, V.: Top 7 examples of big data retail personalization (2018). https://bigdata-madesimple.com/7-examples-of-big-data-retail-personalization/. Accessed 12 Apr 2019
- 29.van Loon, R.: AI’s impact on retail—examples of Walmart and Amazon (2018). https://bigdata-madesimple.com/ais-impact-on-retail-examples-of-walmart-and-amazon/